Building a chrome devtool extension
Use case:
I had recently a new requirement for a utility chrome extension to help with building the most appropriate CSS selector for a given DOM element.
I was initially thinking about the regular extension architecture including a sidebar before going for a little exploration on the google store. I ended up inspiring myself from an existing extension called CSS Selector Helper for Chrome™ which does a very similar job at the cost of less than 300 lines of lines of javascript !
I was able to adapt it to my needs in a few days (including a complete code refactoring and a migration to reactjs)
How to use the extension:
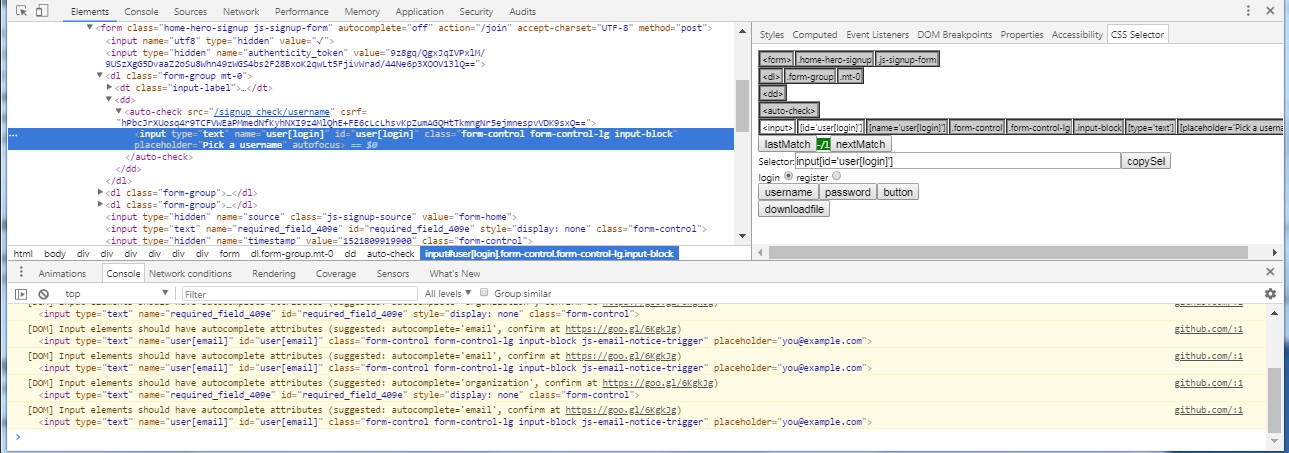
- addon creates a sidebar in the devtools space accessible via inspect/elements/css selector. You'll access it from the devtools panel (elements and then css selector in the right pane menu)
- selects a DOM element using the inspector feature
- addon displays a limited DOM hierarchy with selected attributes for each node level.
- a couple of simple rules apply automatically to compute a starting css selector string.
- the number elements selected by the rule is displayed and addon provides a positive visual feedback when slection is unique.
- user can then refine manually the rule by selecting/clicking additional attributes in the DOM hierarchy.
- user can save the selector to a scenario and finally build a json object with all selectors.
Implementation details:
});
background script => sidebar script
In your sidebar script:
background script => sidebar script
sidebar script => background script
You can find the code at https://github.com/jml674/css-selector
Conclusion: devtools choice is very efficient for this kind of task.
Pros: no hand-managed sidebar, all work facilitated by the devtools API for selecting and visualizing DOM selection.
Cons: UI a bit heavy on accessing the feature: impossible to open quickly the extension main UI thru the extension icon.
I had recently a new requirement for a utility chrome extension to help with building the most appropriate CSS selector for a given DOM element.
I was initially thinking about the regular extension architecture including a sidebar before going for a little exploration on the google store. I ended up inspiring myself from an existing extension called CSS Selector Helper for Chrome™ which does a very similar job at the cost of less than 300 lines of lines of javascript !
I was able to adapt it to my needs in a few days (including a complete code refactoring and a migration to reactjs)
How to use the extension:
- addon creates a sidebar in the devtools space accessible via inspect/elements/css selector. You'll access it from the devtools panel (elements and then css selector in the right pane menu)
- selects a DOM element using the inspector feature
- addon displays a limited DOM hierarchy with selected attributes for each node level.
- a couple of simple rules apply automatically to compute a starting css selector string.
- the number elements selected by the rule is displayed and addon provides a positive visual feedback when slection is unique.
- user can then refine manually the rule by selecting/clicking additional attributes in the DOM hierarchy.
- user can save the selector to a scenario and finally build a json object with all selectors.
Implementation details:
- Create the devtools sidebar in the elements section:
chrome.devtools.panels.elements.createSidebarPane(
(sidebar) => {
// assign an html page to your side bar
sidebar.setPage("sideBarBackground.html");
// register a handler to manage sidebar opening
sidebar.onShown.addListener(function(panelWindow){
});
});
- Capturing a DOM selection:
in your main extension script:
chrome.devtools.panels.elements.onSelectionChanged.addListener(() => {
// let the sidebar script know
this.devToolsPort.postMessage({action:"selectionChanged"});
});
// let the sidebar script know
this.devToolsPort.postMessage({action:"selectionChanged"});
});
- Inspecting an element (ie highlight the element in the inspected window and select the element in the devtools window)
Call to the chrome API inspect() within the context of the inspected page :
inspect (element)
More details on the chrome devtools CLI reference at https://developers.google.com/web/tools/chrome-devtools/console/command-line-reference
- Messaging:
sidebar script => background script
chrome.runtime.onConnect.addListener((port) => {
this.devToolsPort = port;
this.devToolsPort.onMessage.addListener((message, sender, sendResponse) => { });
this.devToolsPort.postMessage({action:"scenarioVariants",variants:this.variants});
In your sidebar script:
background script => sidebar script
this.backgroundPageConnection = chrome.runtime.connect({
name: "devtools-page"
});
this.backgroundPageConnection.onMessage.addListener((message) => {
});
name: "devtools-page"
});
this.backgroundPageConnection.onMessage.addListener((message) => {
});
sidebar script => background script
this.backgroundPageConnection.postMessage({action:"getScenarioVariants"});
- accessing the url of the current page in the main script
chrome.tabs.get(chrome.devtools.inspectedWindow.tabId,(info)=>{
// info.url contains what you want ... if you have included "tabs" in the manifest permissions.
}
Conclusion: devtools choice is very efficient for this kind of task.
Pros: no hand-managed sidebar, all work facilitated by the devtools API for selecting and visualizing DOM selection.
Cons: UI a bit heavy on accessing the feature: impossible to open quickly the extension main UI thru the extension icon.

Comments
Post a Comment